New technologies are adopted chaotically, without oversight.
Ginc Radar tracks the adoption dynamics of technologies, helping you make data-driven decisions about scaling and standardization.
How It Works
1. Connect Git and Jira
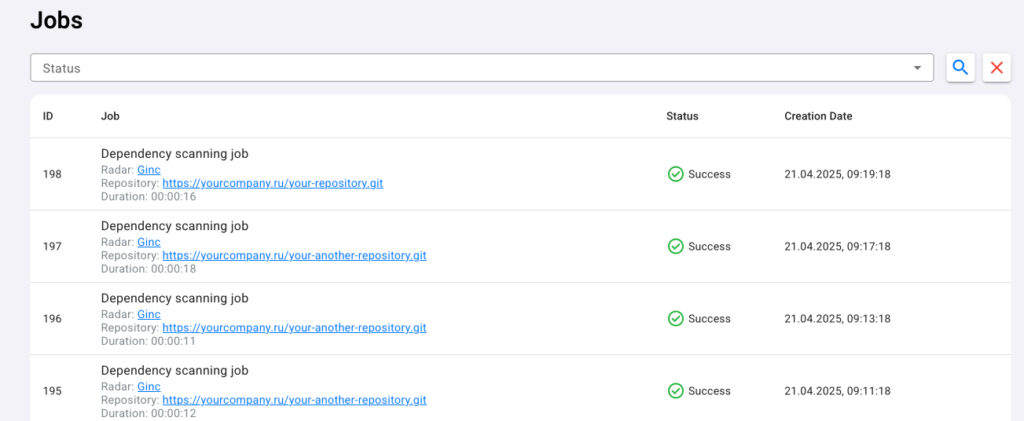
Ginc Radar scans your repositories to automatically collect data on technologies in use.
Integration with Jira provides additional context by linking technologies directly to project boards.
2. Build Your Technology Radar
Ginc Radar visualizes your company’s tech stack by project, lifecycle stage, and adoption depth — helping you instantly see what’s actively used, outdated, or redundant.
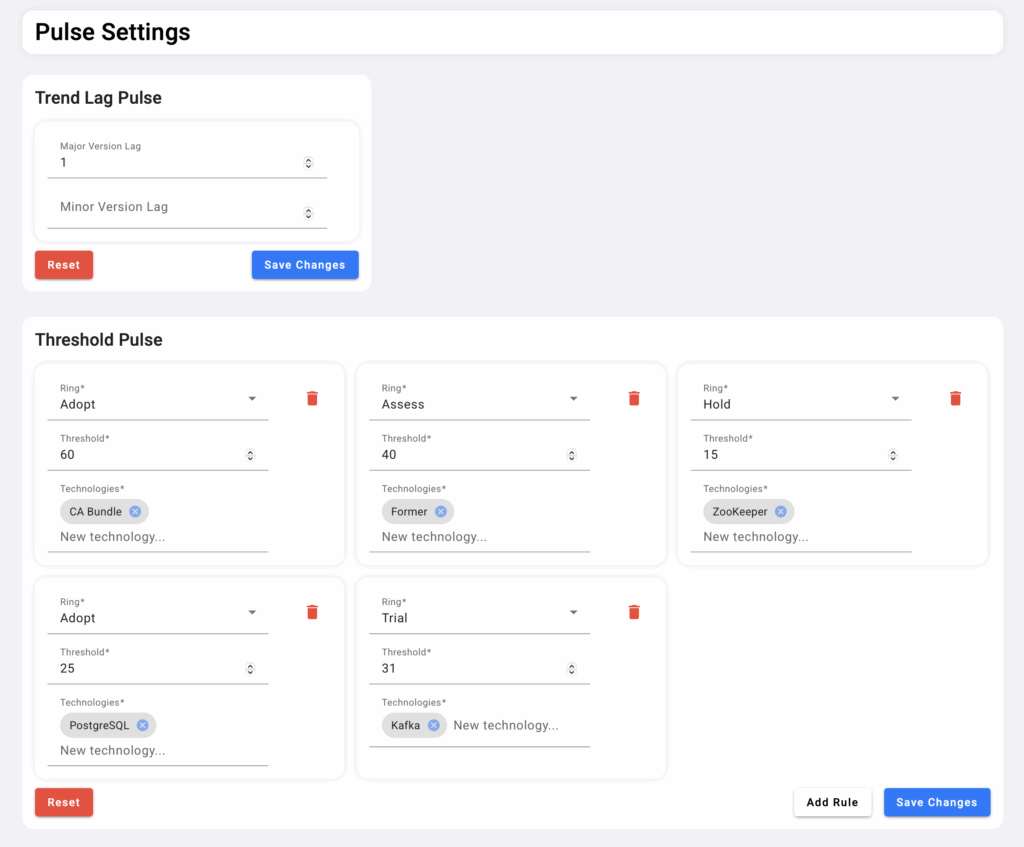
3. Define Rules and Thresholds
Set technology governance policies: allowed technologies, minimum versions, and acceptable adoption levels.
Ginc Radar monitors compliance and alerts you to violations.
4. Ongoing Monitoring and Alerts
The system continuously analyzes repositories and Jira data.
If a technology becomes outdated, used outside policy, or exceeds defined limits — Ginc Radar highlights the issue visually on the radar dashboard.
Real Impact — Measurable Results
Reduce Technical Debt
Identify outdated technologies early and act before they become critical issues.
Less Manual Work
Eliminate surveys and spreadsheets — all monitoring is fully automated.
Fewer Inefficient Decisions
Prevent “shadow technologies” and unnecessary stack duplication.
Higher Project Stability
Timely tech updates reduce risks and improve long-term maintainability.
FAQ
Мы ответили на несколько вопросов, возникающих при обсуждении технологического радара Ginc Radar:
Absolutely. Ginc Radar runs locally within your infrastructure — no source code or data leaves your environment. All analysis happens on-premise, ensuring full data privacy and compliance.
Beyond visualization, Ginc Radar helps you set and track strategic technology goals — such as minimum adoption rates or maximum version gaps — enabling data-driven IT planning and progress tracking.
Yes. Ginc Radar identifies legacy technologies and suggests which should be updated or replaced. It supports planning gradual modernization strategies to minimize risks and costs — keeping your stack future-ready.
Request a Ginc Radar Demo
Submit a request on our website — our specialists will contact you to arrange a live demo and assist with installation.
Key Features of Ginc Radar
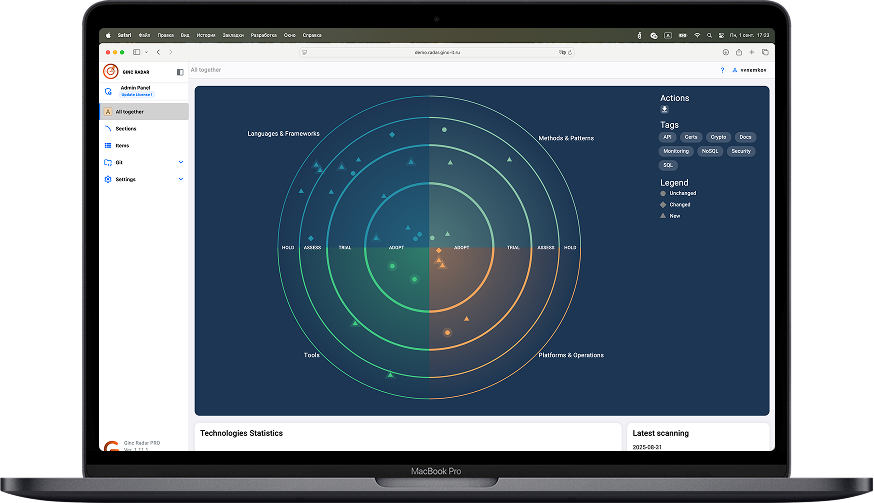
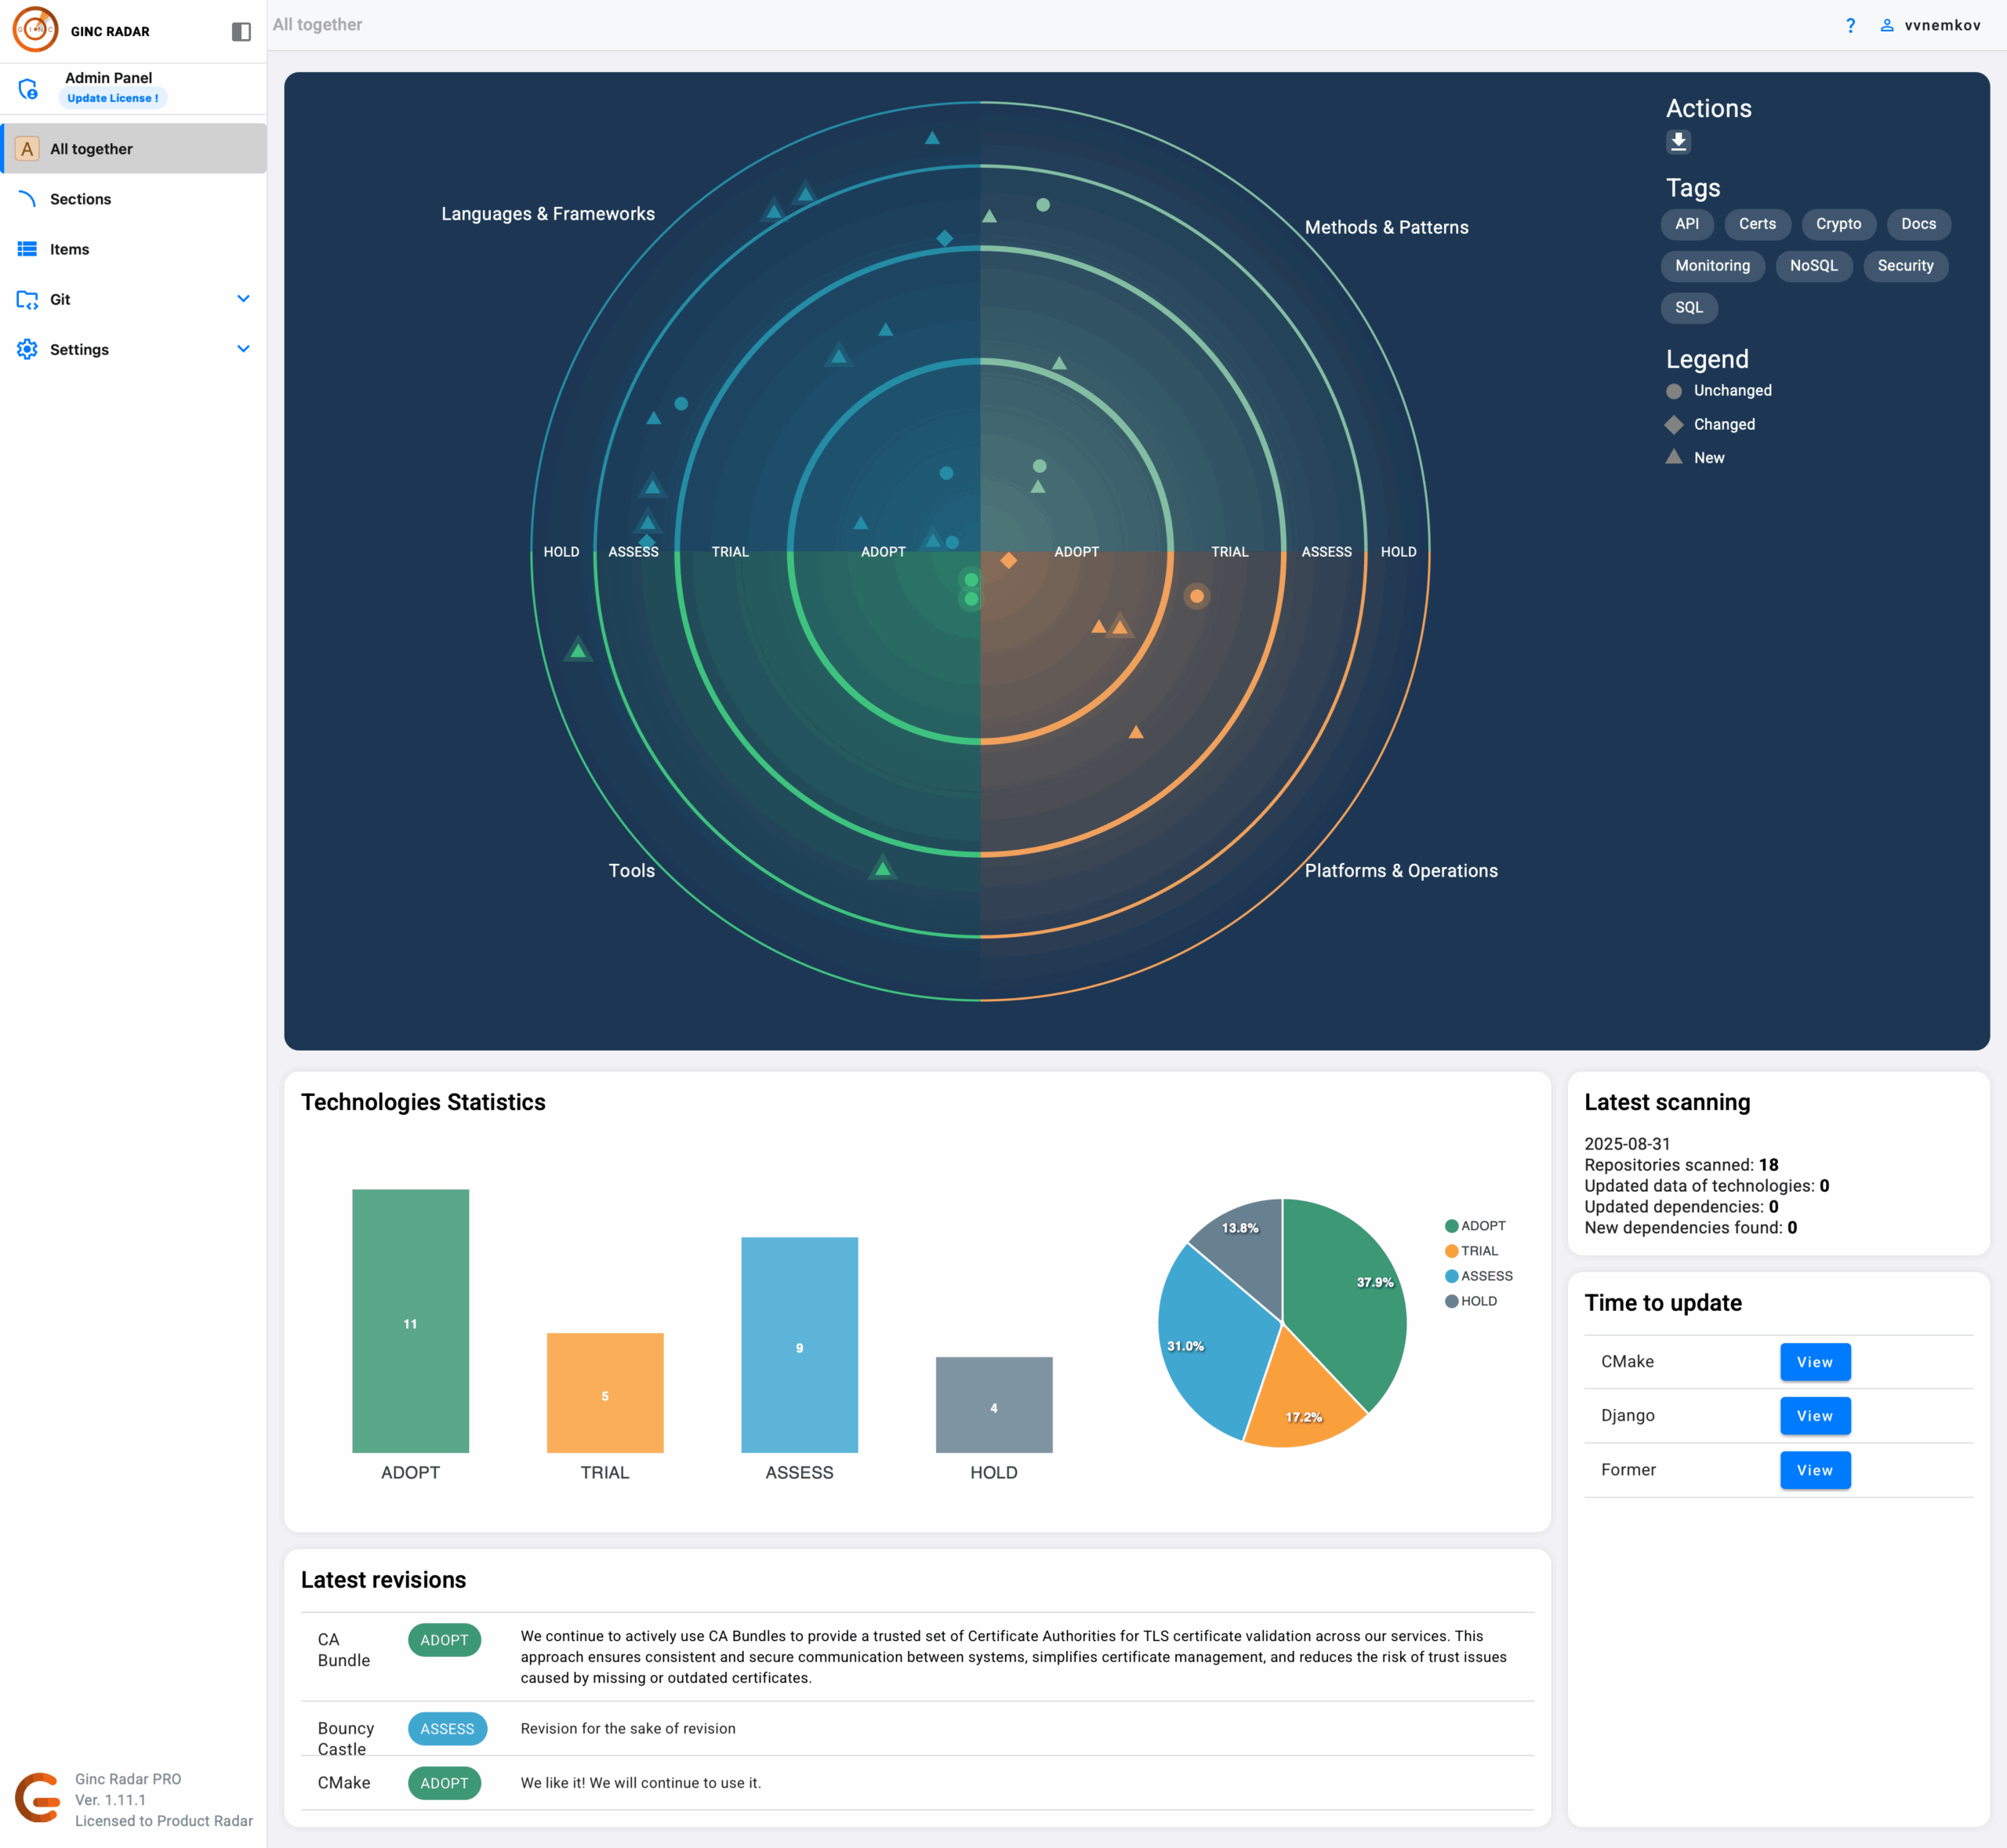
Main Dashboard
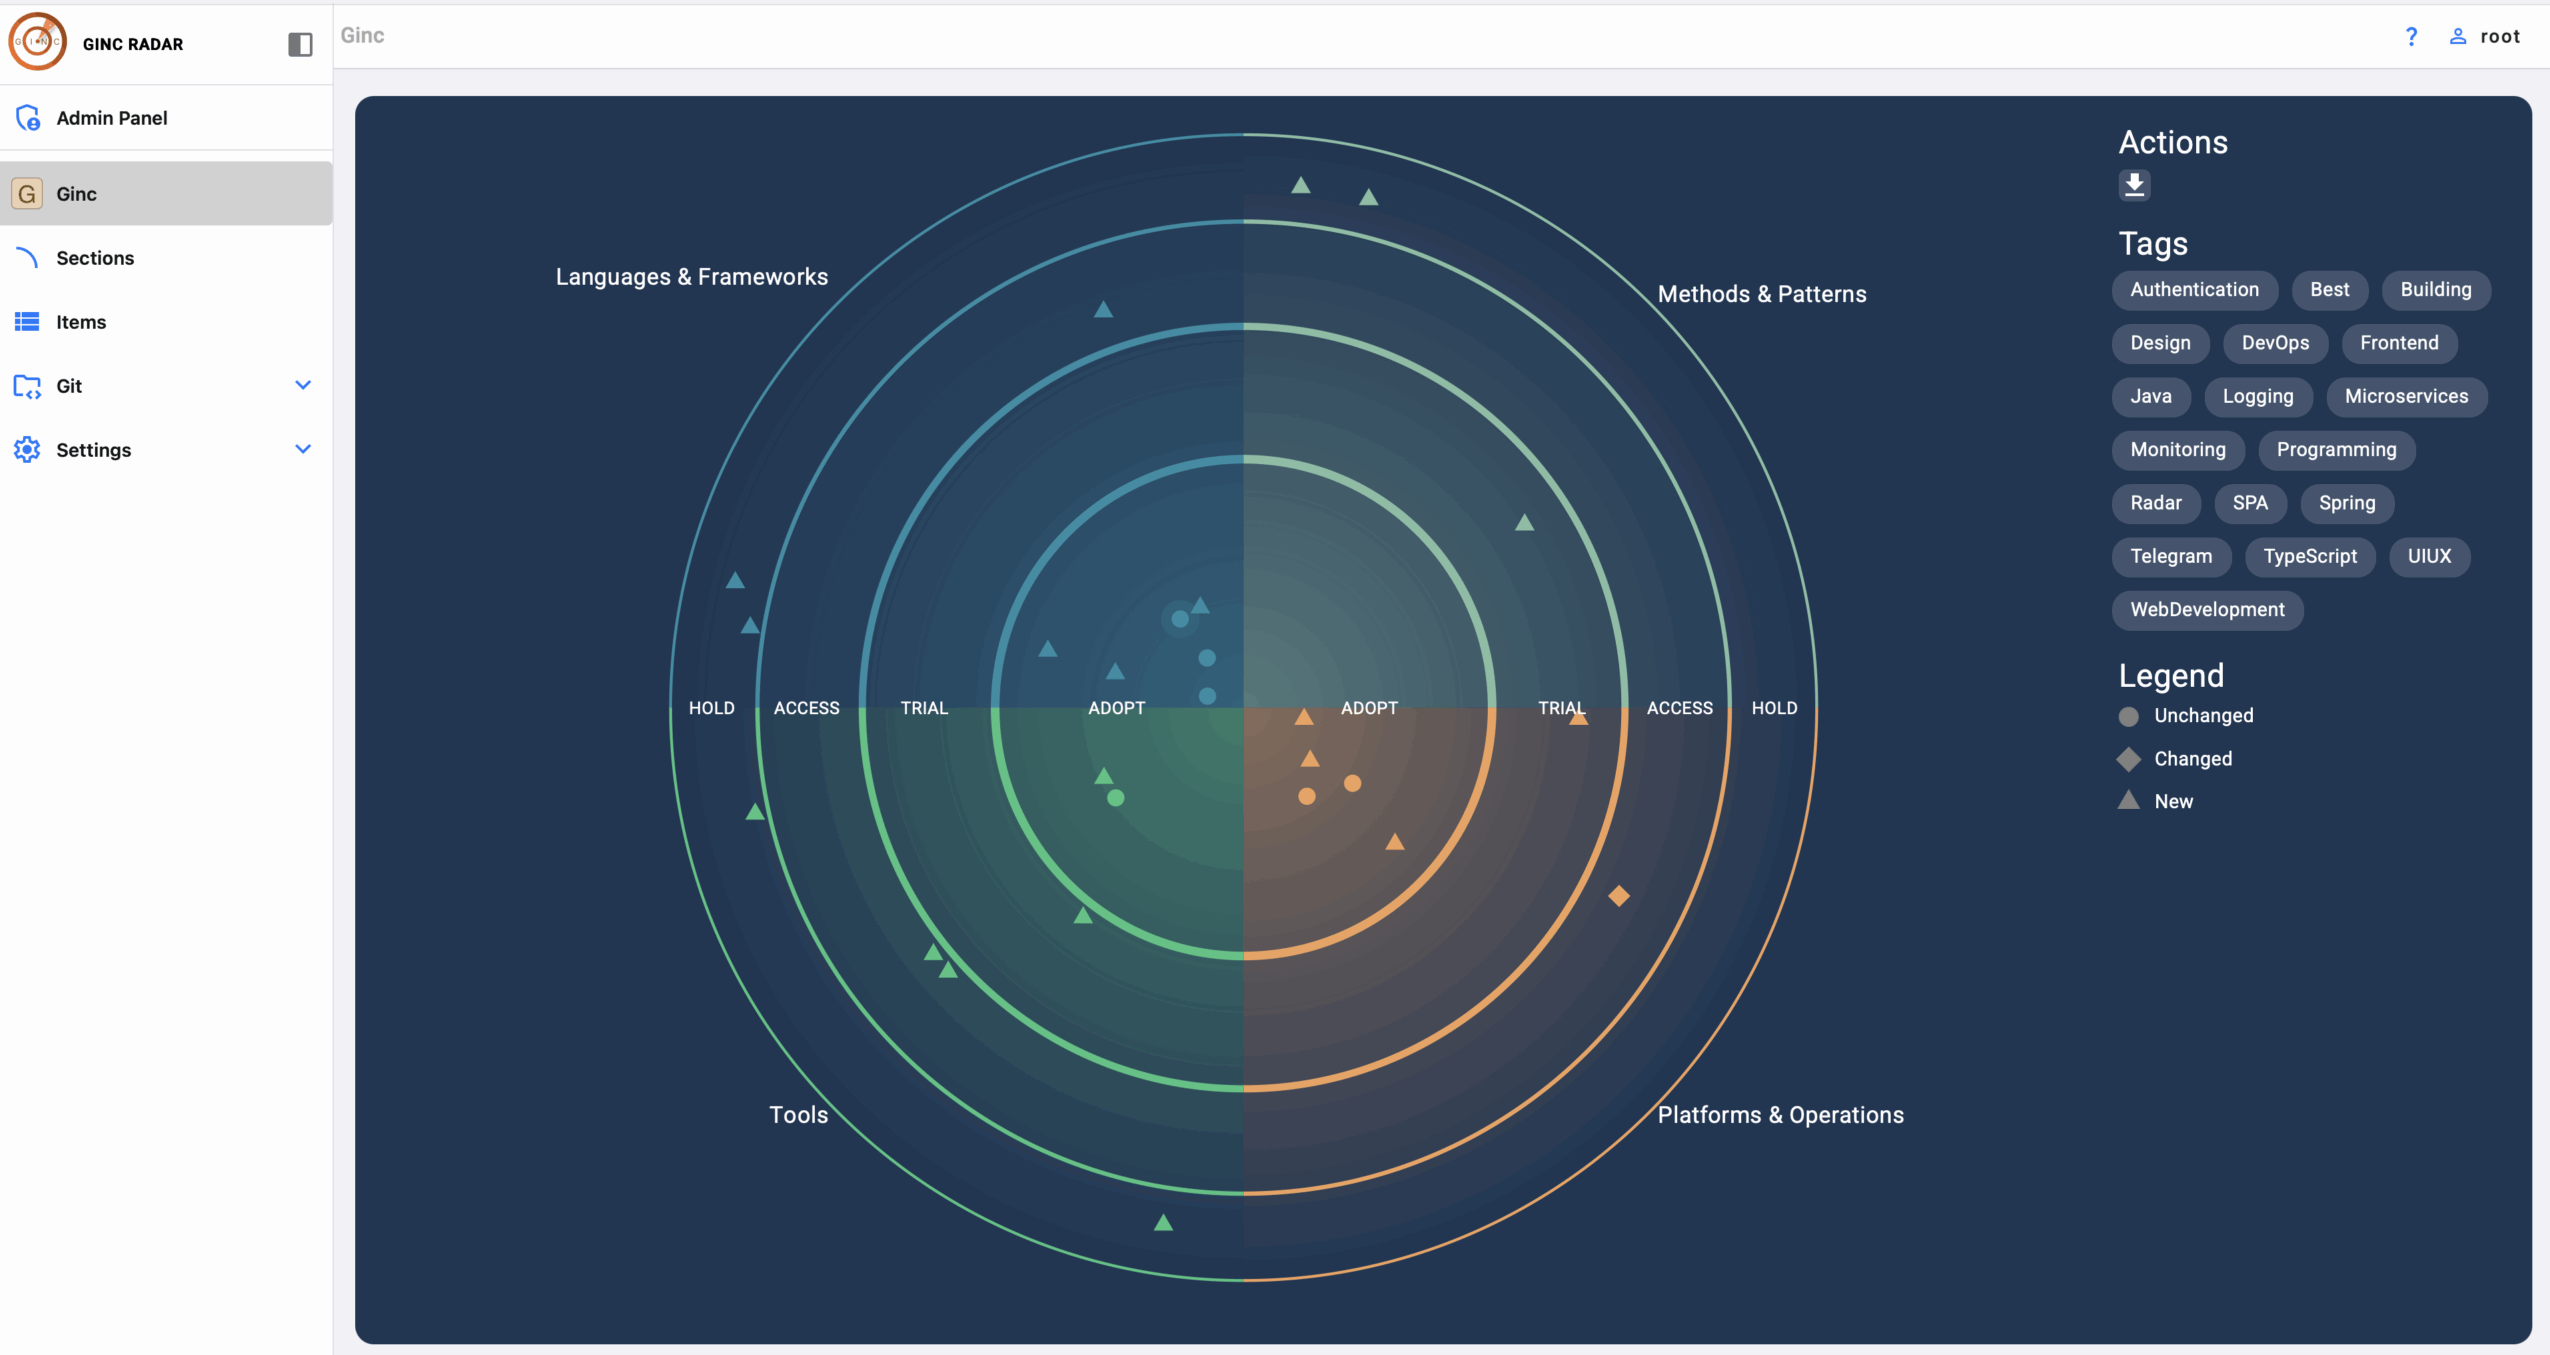
The core of Ginc Radar is an interactive technology radar — a dynamic, visual dashboard that provides a clear overview of all technologies used across your organization.
Each technology is represented as a marker on the radar, grouped into categories such as Languages & Frameworks, Platforms, and more. Within each category, technologies are positioned according to their adoption level:
ADOPT — actively used and recommended
TRIAL — currently being tested or piloted
ASSESS — available for evaluation
HOLD — paused or not recommended for use
The radar isn’t static — it’s alive and constantly evolving. If Ginc Radar detects an issue (for example, an outdated version, excessive usage, or a strategic policy violation), the corresponding marker begins to pulse, drawing attention to areas that require review or action.
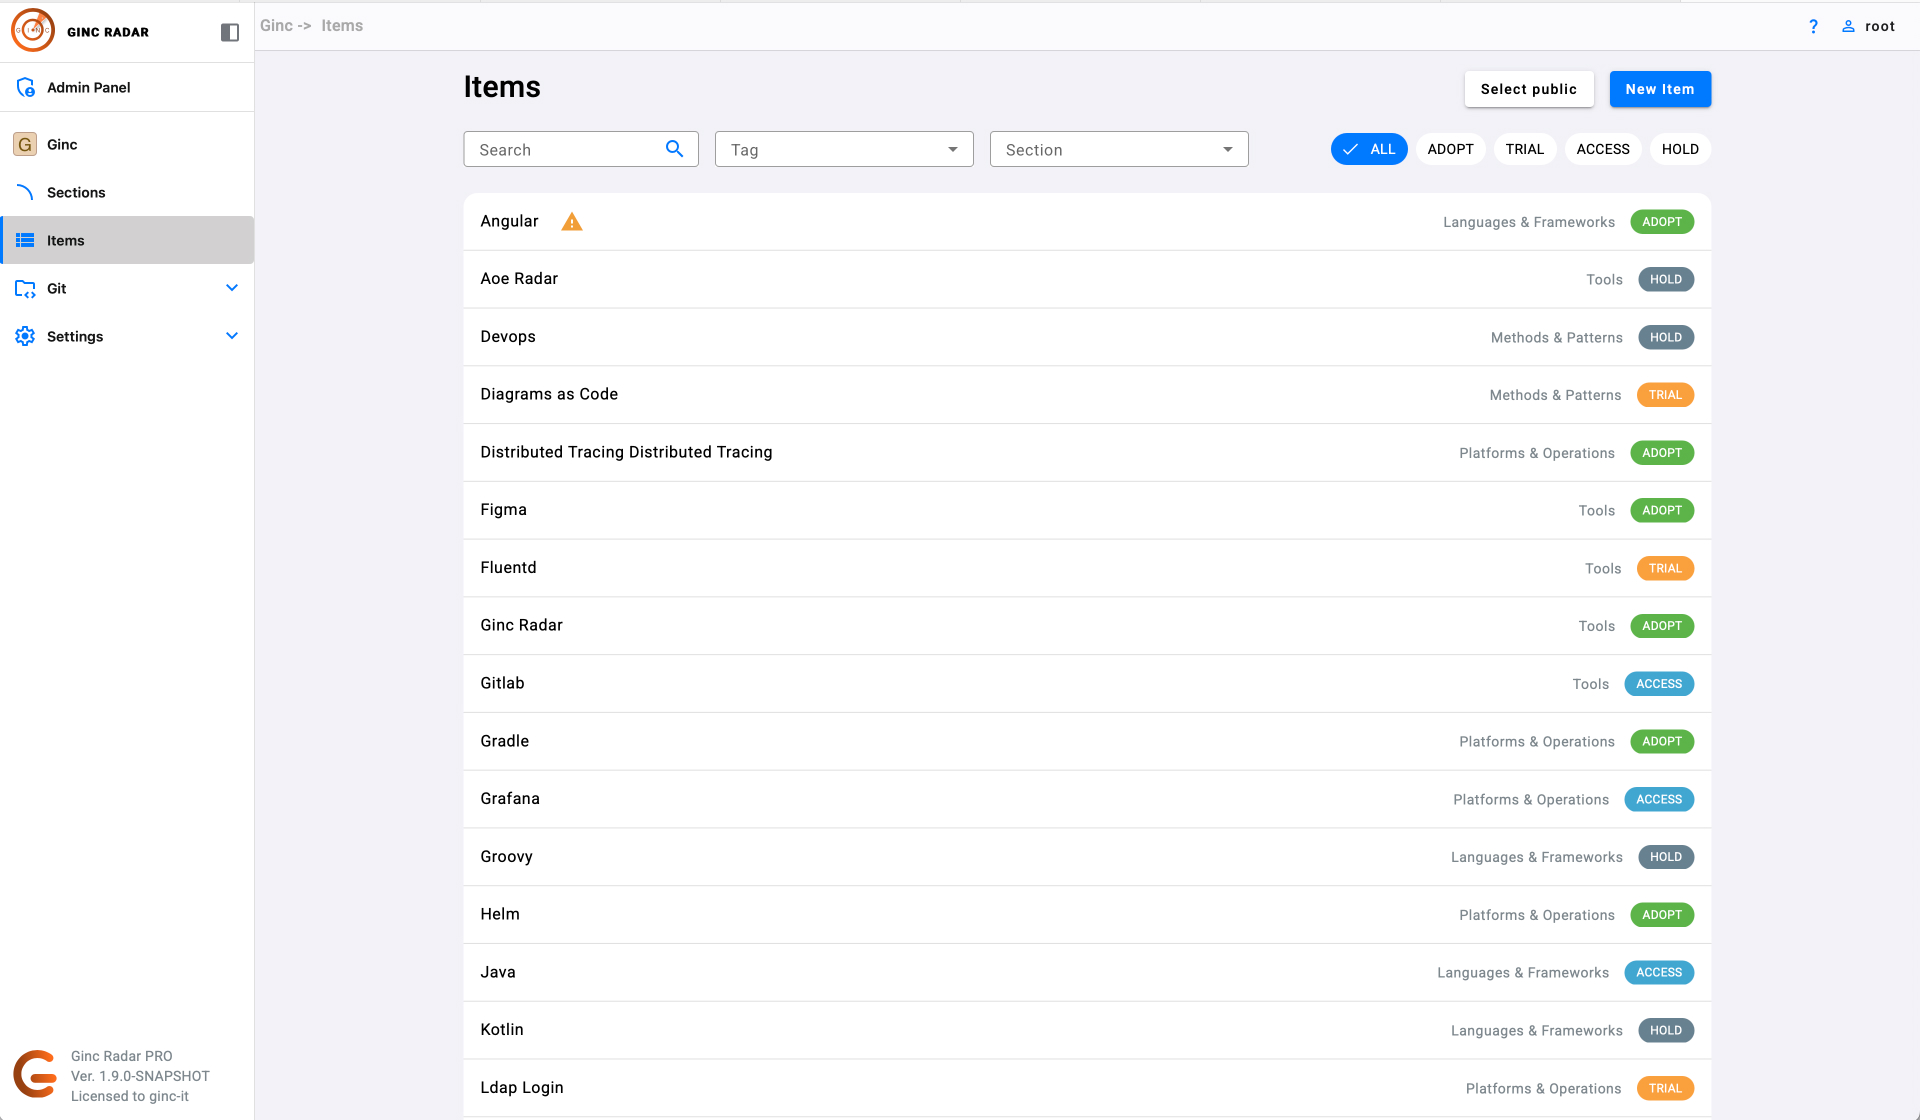
Technology List
The Technology List provides a structured view of all technologies detected and registered within Ginc Radar. It serves as a convenient registry for tracking, filtering, and managing technologies across your organization.
Available functionality:
Technology name and key info — each row displays the technology name, its category, and current adoption level (ADOPT, TRIAL, ASSESS, HOLD).
Quick access to details — open the Technology Card with a single click to view usage history, adoption depth, related projects, and detected issues.
Filters and search tools:
Full-text search
Filter by category
Filter by adoption level
Filter by tags
Public Radar
You can choose which technologies appear on your Public Radar — a read-only, external view accessible to other teams or partners outside your organization. This helps you showcase your technology landscape, promote transparency, and share knowledge across the community.
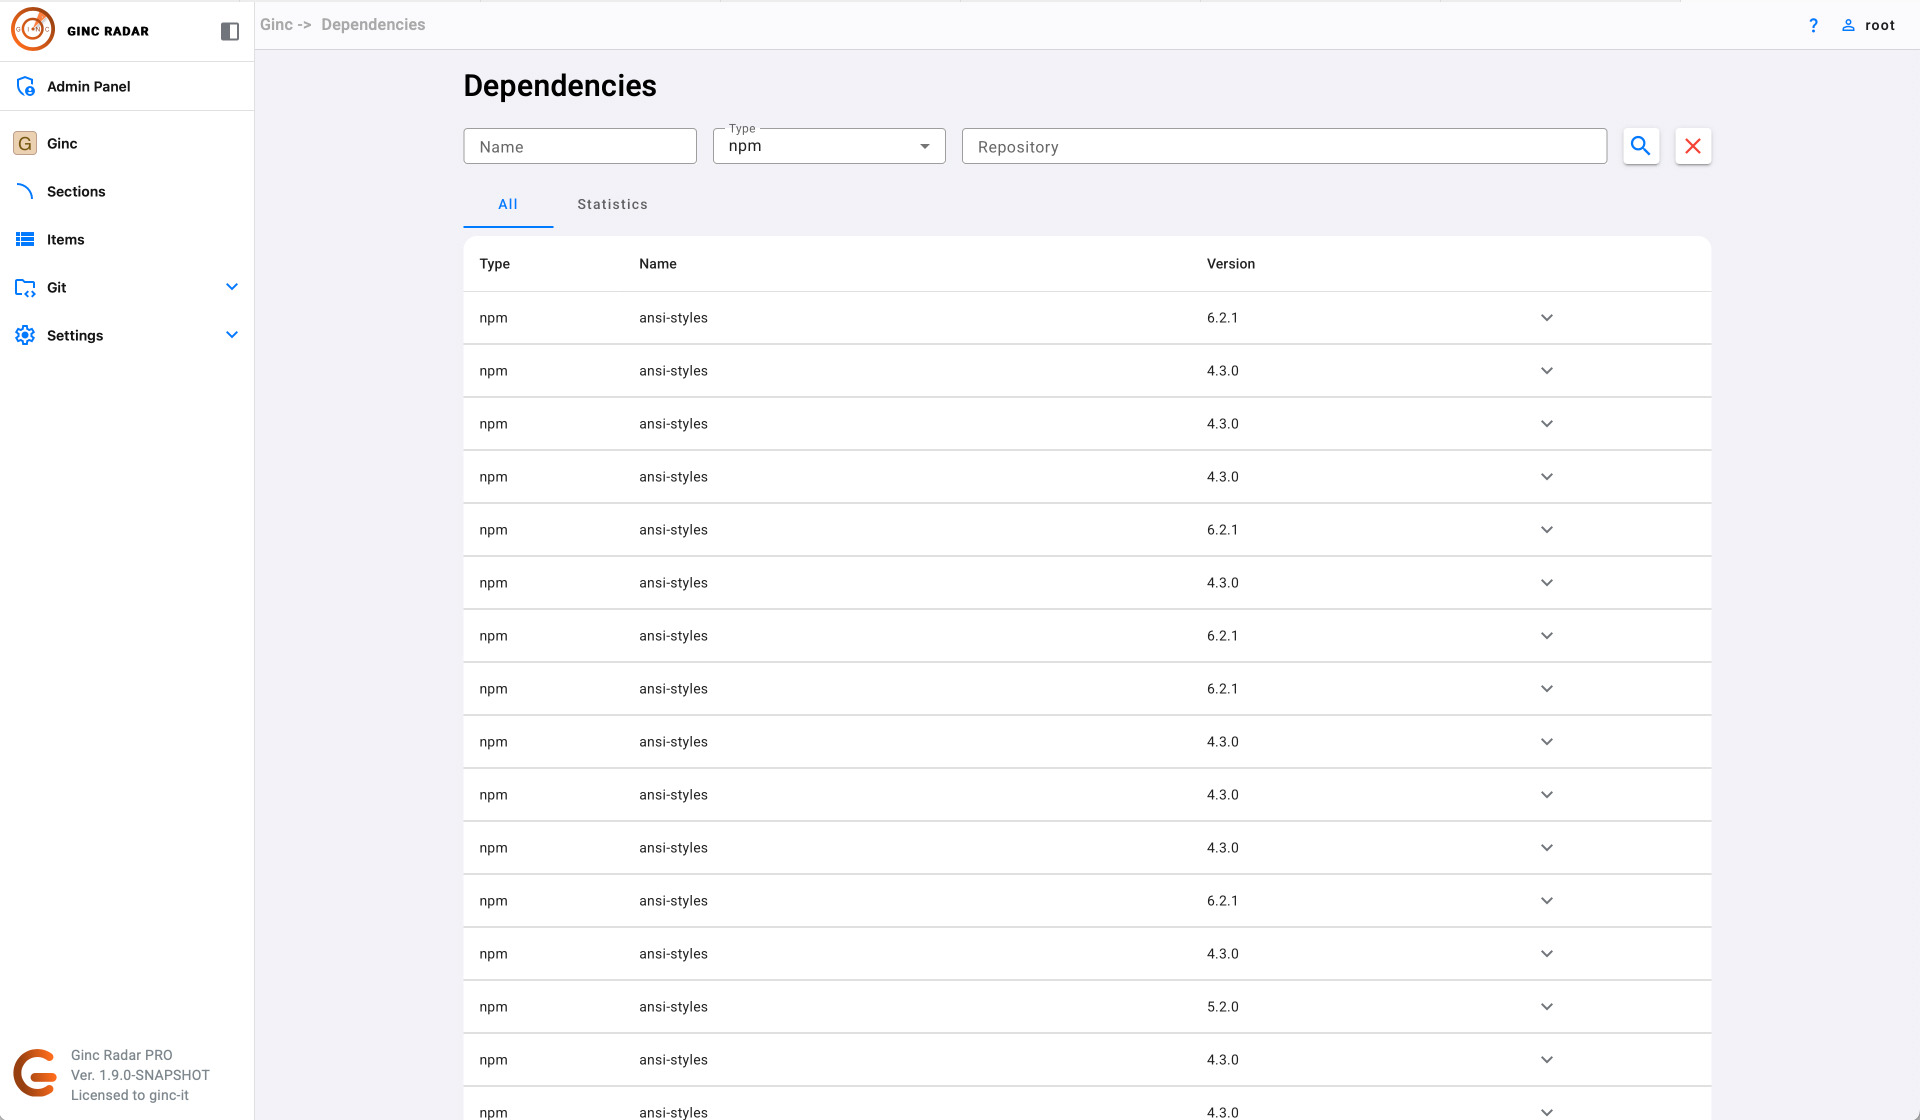
Dependency List
The Dependency List is a central hub for visibility into all libraries, frameworks, and external packages used across company projects. It provides a clear picture of dependency versions, compatibility, and potential security risks.
Main elements:
Dependency name and version — displays the exact version currently in use.
Package manager type — shows which manager (e.g., npm, Composer, Maven, etc.) was used to install it.
Location — instantly see which repositories include this dependency, making it easy to assess its reach and impact across projects.
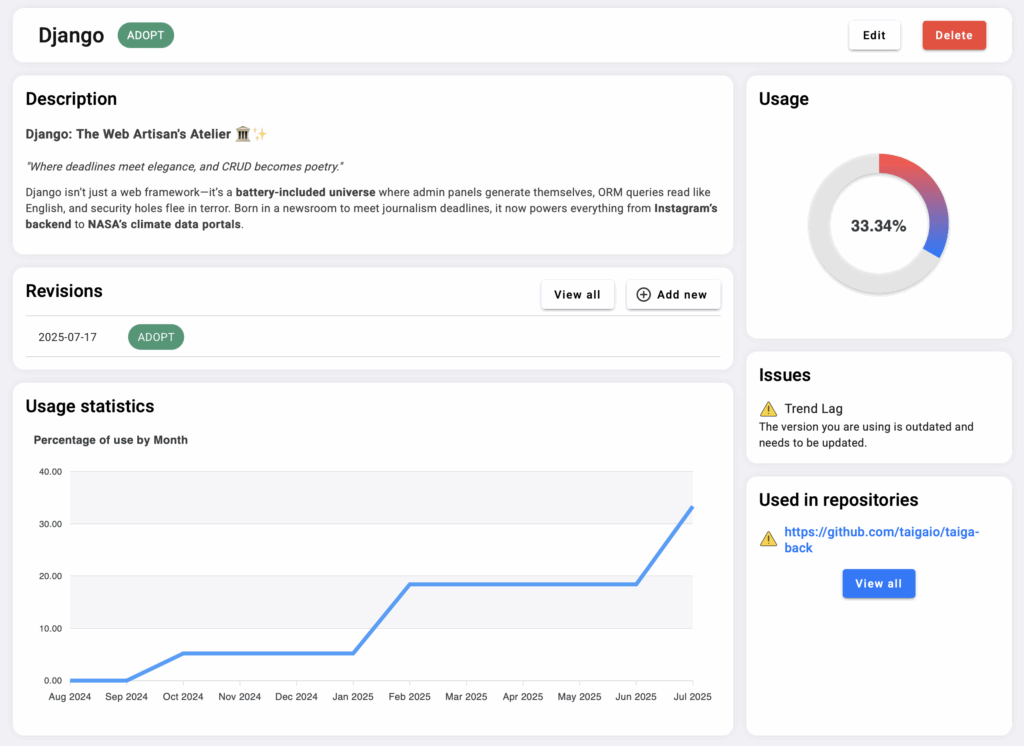
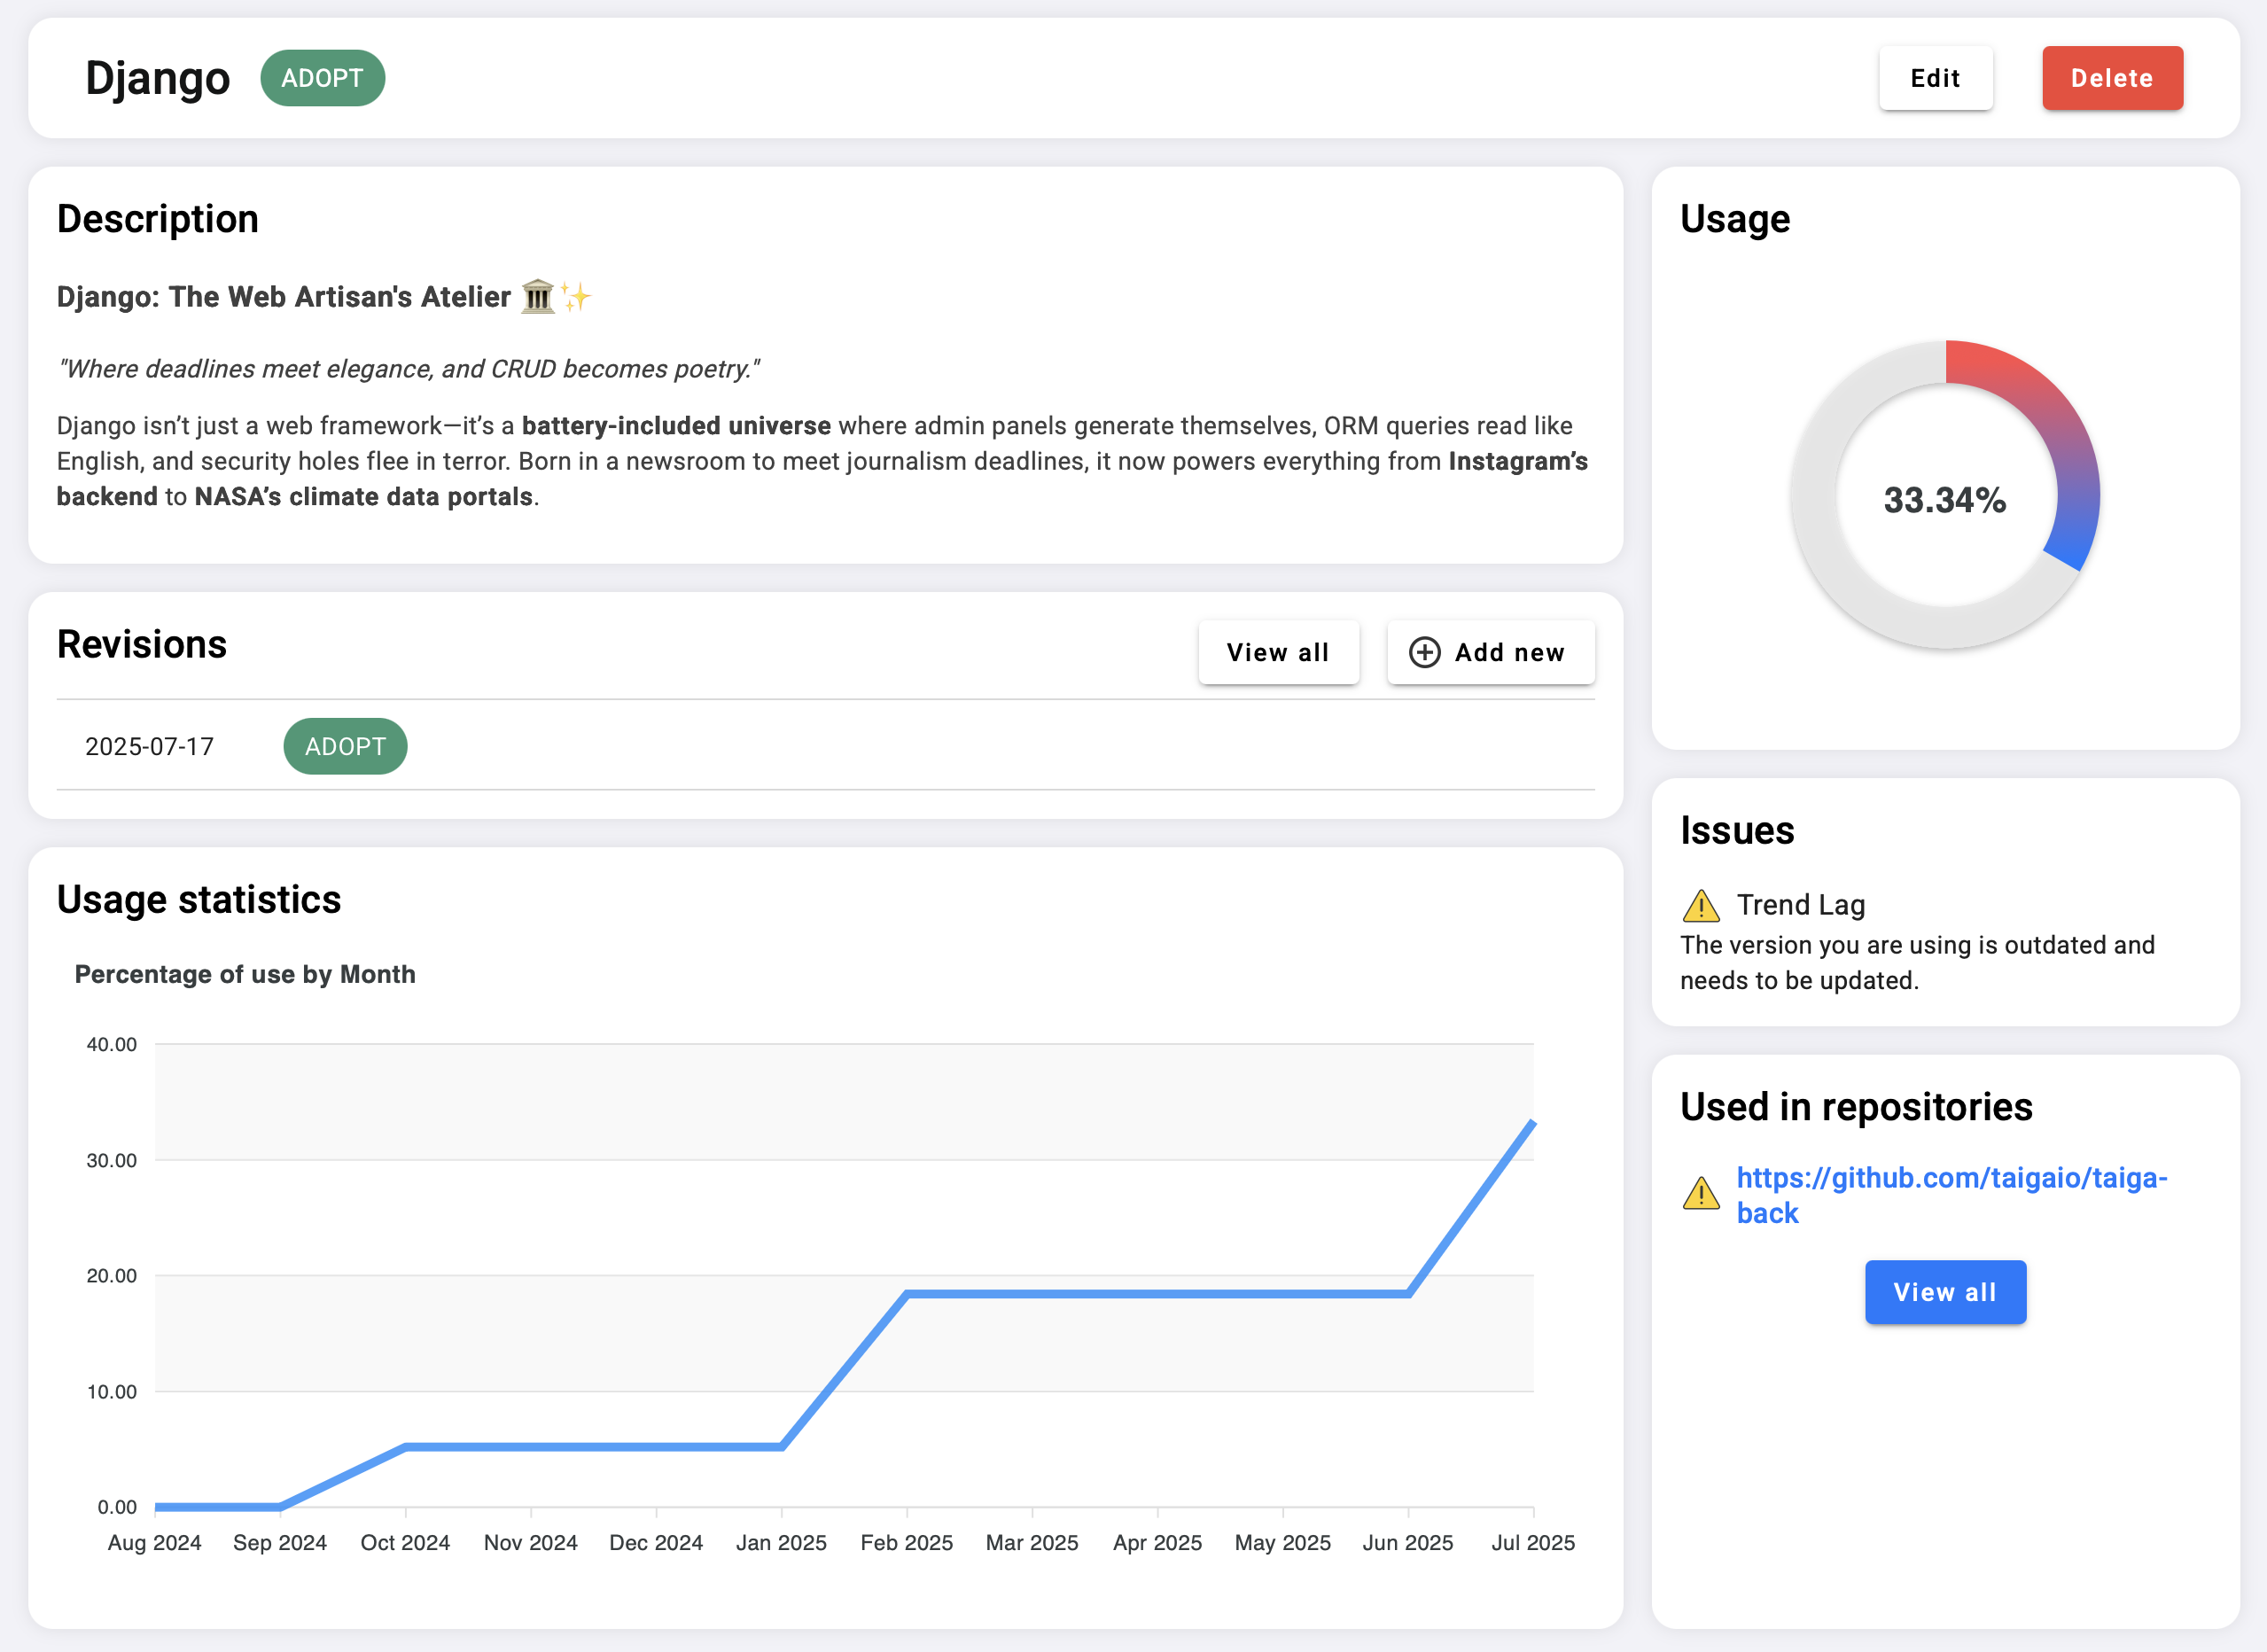
Technology Card
The Technology Card is a detailed profile page containing all key information about a specific technology used in your organization. It allows both high-level analysis and precise management of technology data.
Key elements:
Technology name
Usage rate — automatically calculated from all repositories to show real adoption levels.
Adoption level — current status (ADOPT, TRIAL, ASSESS, HOLD), editable at any time.
Issues and alerts — highlights detected risks, outdated versions, or violations.
Revision history — tracks all status or description updates over time, showing how the technology’s position evolved within the company.
Add new revision — log changes as your tech landscape evolves.
Repository usage overview — full list of repositories where this technology was found.